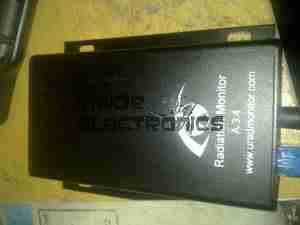
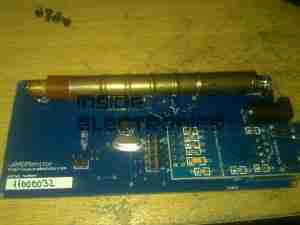
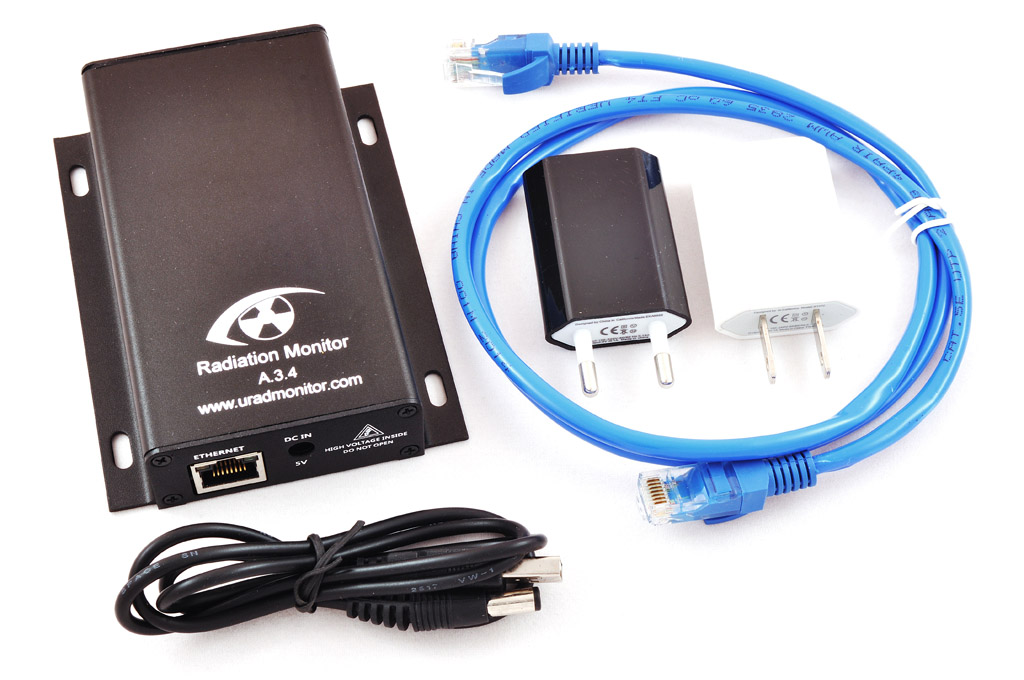
I’ve been meaning to sort some local graphs out for a while for the radiation monitor, and I found a couple of scripts created by a couple of people over at the uRadMonitor forums for doing exactly this with RRDTool.
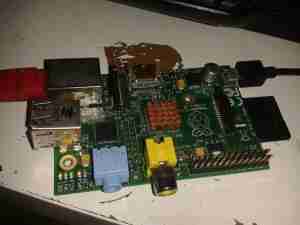
Using another Raspberry Pi I had lying around, I’ve implemented these scripts on a minimal Raspbian install, and with a couple of small modifications, the scripts upload the resulting graphs to the blog’s webserver via FTP every minute.
[snippet id=”1759″]
This script just grabs the current readings from the monitor, requiring access to it’s IP address for this.
[snippet id=”1760″]
This script sets up the RRDTool data files & directories.
[snippet id=”1761″]
The final script here does all the data collection from the monitor, updates the RRDTool data & runs the graph update. This runs from cron every minute.
I have added the command to automate FTP upload when it finishes with the graph generation.
This is going to be mounted next to the monitor itself, running from the same supply.
The Graphs are available over at this page.
